NHK Laboratories Note No. 486


Perceptual Discrimination between Musical Sounds
with and without Very High Frequency Components


Toshiyuki Nishiguchi, Kimio Hamasaki, Masakazu Iwaki, and Akio Ando

Three-Dimensional Audio-Visual System


Abstract

  We conducted subjective evaluation tests to study perceptual discrimination between musical sounds with and without very high frequency components (above 21 kHz). In order to conduct strict evaluation tests, the sound reproduction system used for these tests was designed to exclude any leakage or influence of very high frequency components in the audible frequency range.
As a result, no significant difference was found between sounds with and without very high frequency components among the sound stimuli and the subjects. From these results, however, we can still neither confirm nor deny the possibility that some subjects could discriminate between musical sounds with and without very high frequency components. Nevertheless, the results also showed that the test system is entirely reliable, and that further evaluation tests using this test system will accurately show whether the very high frequency components in sound stimuli affect human recognition of sound quality.

1.  INTRODUCTION
It is generally accepted that humans cannot perceive sounds in a very high frequency range of over 20 kHz. Thus, the upper limit of the frequency range in conventional digital audio formats such as CD, DAT and digital audio broadcasting is typically set at about 20 kHz.


Nevertheless, some papers have discussed the influence of such “inaudible” high frequency components in musical sounds on the auditory sense or brain activity in recent years [1,2,3,4], and in recent years, digital audio formats such as SACD and DVD-Audio having a frequency response of close to 100 kHz have become available.


If such extension of the frequency range affects the perception of sound, it must be caused by reproduction of very high frequency components or some other factor. If very high frequency components are the major factor, then recording and reproduction of very high frequency components would be important. However, if some other factor is dominant, it would be independent of frequency range and so efforts to improve sound quality should be focused on this factor rather than on frequency range.


Accordingly, we conducted subjective evaluation tests to study perceptual discrimination between musical sounds with and without very high frequency components, which are defined as frequencies above 21 kHz. In order to make a pure comparison of sound with and without very high frequency components, the sound reproduction system for these tests was designed to exclude any leakage or influence of very high frequency components in the audible frequency range. The sound stimuli of various pieces of music used for the evaluation tests were newly recorded by authors to maintain the highest quality for proper sound reproduction. Most of the subjects for this evaluation tests were selected from professional audio experts and musicians.

2. Test System and Method
2.1. Test System

In order to conduct strict evaluation tests, the sound reproduction system for these tests was designed to exclude any leakage or influence of very high frequency components in the audible frequency range, whereas some previous studies had been unable to exclude such leakage or influence.
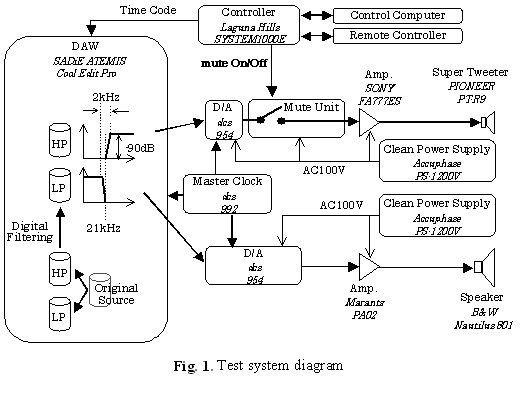
Our test system consisted of two completely independent sound reproduction systems, one for the audible frequency band, and the other for the very high frequency band as shown in Fig. 1. Each system had independent sound equipment, namely D/A converters, power amplifiers, loudspeakers, and power supply units.

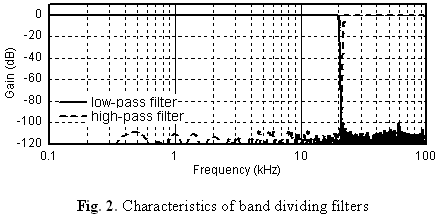
Each sound source used as a test stimulus was divided into two frequency bands by 1024 taps FIR digital low-pass and high-pass filters, which had very sharp roll-off characteristics as shown Fig. 2. The cut-off frequency for the low-pass filter was 20 kHz, and that of the high-pass filter was 22 kHz. The transition bandwidth of both filters was 1 kHz and the rejection ratio in the stop bands for these was set over 90 dB. Therefore, the sound sources were divided almost perfectly into an audible frequency band (below 21 kHz) and a very high frequency band (above 21 kHz) without any overlap in the frequency domain, and each sound was recorded independently on a DAW. Each recorded sound was reproduced independently and synchronized in time.


Fig.1 Test system diagram

A mute unit was inserted between the amplifier and D/A converter of the very high frequency band. Through the evaluation tests, the sound of the audible frequency band was always reproduced and the sound of the very high frequency band was muted or reproduced according to the test sequence. As this method excludes any influence of inter-modulated distortion by the very high frequency band components within the audible frequency band [5,6,7], it is possible to make an absolute comparison between sounds with and without very high frequency components. The digital equipment in the test system was operated at a sampling rate of 192 kHz and with 24-bit resolution.

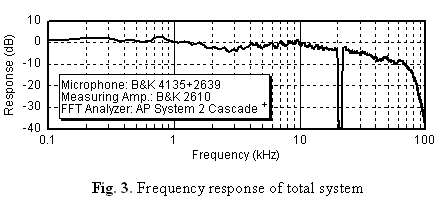
The evaluation tests were conducted in a listening room that was designed based on ITU-R BS1116. Loudspeakers were placed in a two-channel stereophonic arrangement. The distance between each loudspeaker and the subject was set at 2.9 m. The height of the subject’s ear was adjusted to the height of the super tweeter which reproduces the very high frequency band. The overall frequency response of this test system is shown in Fig. 3. At 70 kHz, the level dropped to approximately –10 dB from the reference level of 1 kHz.

While the sound reproduction level of each stimulus was set at approximately 80 dB(A) at its peak level as the standard reproduction level, the subject was allowed to control the level within –3 to +7 dB.


2.2. Test Method

The evaluation test is based on the duo-trio test method. The subjects were asked to listen to three sound stimuli labeled “R,” “A,” and “B.” “R” was always reproduced with very high frequency components, whereas “A” and “B” were reproduced without very high frequency components, and the other was reproduced with very high frequency components.
The subject was asked to identify which of the two sounds, “A” or “B,” was the same as “R”. The subjects were allowed to select the sound source that they wished to listen to from among “R,” “A,” and “B.” Each sound stimulus could be replayed repeatedly until the subject reached a final decision.


3. Evaluation Test


This evaluation test was designed to estimate any possibility of perceptual discrimination between musical sounds with and without very high frequency components and to confirm any influences of the characteristics of very high frequency components of each sound stimulus on the results of the tests.

3.1. Sound Stimulus

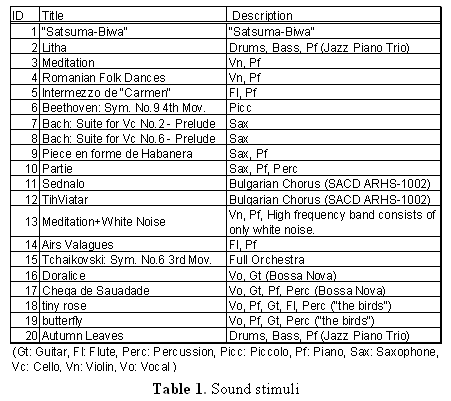
Twenty kinds of sound stimuli with various combinations of different musical instruments were prepared as shown in Table 1. For such evaluation tests, it is very important to maintain the highest possible quality of sound stimuli, therefore, all the sound stimuli except No. 11, 12, and 13 were originally recorded by the authors using a high quality recording system with a sampling rate of 192 kHz, 24-bit resolution, and high-quality microphones which can capture sounds up to very high frequency.
Number 13 was an artificially-produced stimulus whose auditory band component was exactly the same as that of No. 3, and the very high frequency components were replaced by white noise at a constant level.
Numbers 11 and 12 were selected from SACD sound materials.


3.2. Subjects

The subjects were 30 males and 6 females including 33 experts in audio engineering, 2 students, and the musician who had recorded the sound stimuli. They consisted of 3 teenagers, 12 in their twenties, 16 in their thirties, 3 in their forties and 2 in their fifties.


3.3.  Results

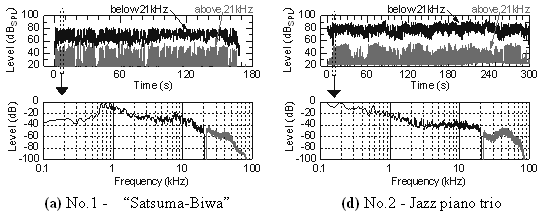
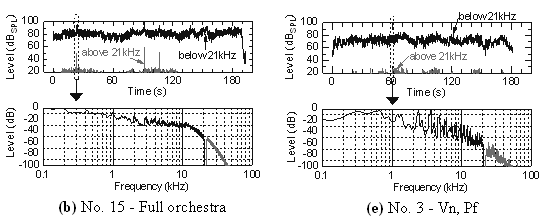
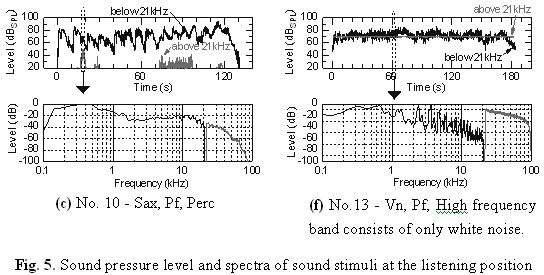
The tests were conducted on 36 subjects who evaluated each sound stimulus once or twice. Thus, each stimulus was evaluated 40 times in total. Figure 4 shows the rate of correct response for each sound stimulus in the 40 trials. Since the prior probability of correct responses was considered to be 50%, the significance probability of this evaluation test with the 40 trials was set at 66% (shown by the dashed line in Fig. 4) at a significance level of 5%. This figure shows that the three sound stimuli No. 1, 15 and 10 are close to the significance probability at a significance level of 5%. Figure 5-(a), (b) & (c) show the sound pressure level and the spectrum of each sound stimulus at the listening position and the standard reproduction level, which was estimated from the sound source spectrum, and the magnitude-frequency characteristics of the test system as shown in Fig. 3.
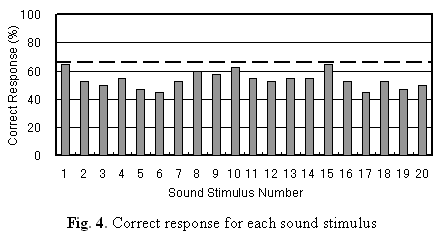

The correct responses of No. 2, 3 and 13 are close to the chance level. Figure 5-(d), (e) & (f) show a similar analysis for No. 2, 3 and 13. Number 13 was the stimulus artificially produced by replacing the very high frequency components of No. 3 with white noise at a constant level. Although the overall level of the very high frequency components of No. 2 and 13 is greater than that of the other sound stimuli, it has no significant difference on hearing between the cases with and without very high frequency components.


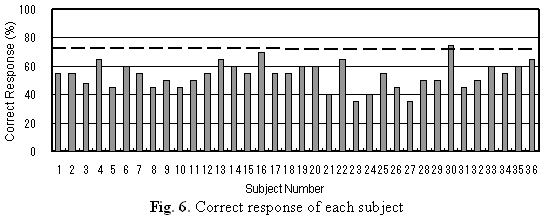
Figure 6 shows the correct response rate of each subject. Since the prior probability of correct responses with 20 trials of different stimuli by each subject was 50%, the significance probability of this evaluation test was set at 72% (shown by the dashed line in Fig. 6) at a significance level of 5%. From this result, it is clear that one subject (a 17-year-old female) attained a 75% correct response rate which was a significant difference at the 5% level.


4. Supplementary Test

The primary tests suggested that the results of such discriminations might depend on the subject and the characteristics of the very high frequency components of each sound stimulus. Therefore, repeated evaluation tests using the same stimuli and the same subjects should provide more reliable conclusions and discussions. Accordingly, we conducted a supplementary test with a selected subject and selected sound stimuli, using the same test system and method.


4.1. Subject and Sound Stimulus

The subject was the 18-year-old female who attained the best correct answer rate in the primary test.

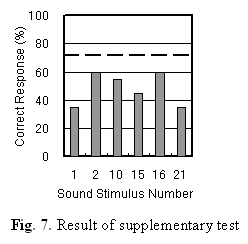
Six kinds of sound stimulus were prepared. Five sound stimuli, No. 1, 2, 10, 15, and 16, were chosen from Table 1. Number 1, 10 and 15 gave the top-three correct response rate (see Fig. 4) in the first test. Number 16 was judged “easy to discriminate” by the subject. Number 2 did not show a significant difference in the total results as shown in Fig. 4, however, it was discriminated correctly by the subject in the test, and contained rich very high frequency components. Number 21 was an artificially-produced stimulus whose auditory band component was exactly the same as that of No. 1, and the very high frequency components were replaced by white noise at a constant level.


4.2. Results

The subject evaluated each sound stimulus 20 times. Figure 7 shows the rate of correct response for each sound stimulus in 20 trials. Since the prior probability of correct responses was 50%, the significance probability of this evaluation test with the 20 trials was set at 72% (shown by the dashed line in Fig. 7) at a significance level of 5%. Each sound stimulus showed no significant difference, and so the subject could not discriminate between these sound stimuli with and without very high frequency components.

5. Conclusions

Thirty-six subjects evaluated 20 kinds of stimulus, and each stimulus was evaluated 40 times in total. The results showed no significant difference among the sound stimuli, but that the correct response rate for three sound stimuli was close to the significance probability (5% level). Furthermore, it showed that one subject attained to a 75% correct response rate, which indicated a significant difference. In order to confirm the reliability of this result, a strict statistical supplementary test with this subject also was conducted. This subject evaluated 20 times over six kinds of sound stimulus. As a result, no significant difference was found among the six sound stimuli. Therefore, it is concluded that this subject could not discriminate between these sound stimuli with and without very high frequency components.

From above results, we can still neither confirm nor deny the possibility that some subjects could discriminate between musical sounds with and without very high frequency components. It is therefore necessary to conduct further repetitive evaluation tests with many subjects and various sound stimuli that contain sufficient very high frequency components, in order to examine these issues more strictly.

Nevertheless, the results also showed that the test system is entirely reliable, and can exclude any leakage or distortion in the audible frequency range caused by the very high frequency components. Further evaluation tests using this test system will therefore accurately show whether the very high frequency components in sound stimuli affect human recognition of sound quality.


Reference


[1] T. Oohashi, E. Nishina, M. Honda, et al., “Inaudible High-Frequency Sounds Affect Brain Activity: Hypersonic Effect”, J. Neurophysiology, pp. 3548-3558 (2000).
[2] S. Yoshikawa, S. Noge, M. Ohsu, et al., “Sound Quality Evaluation of 96kHz Sampling Digital Audio”, AES 99th Convention, New York, USA, Convention Paper 4112 O-3 (1995).
[3] K. Ashihara, S. Kiryu, K. Kurakata, et al., “Perceptual effects caused by high- and ultrasonic-frequency components in musical sounds”, AES 9th Regional Convention, Tokyo, Japan, Preprint, pp. 18-21 (2001).
[4] K. Kurakata, N. Nakamura, A. Shibasaki, et al., “Perceptual effects of high- and ultrasonic-frequency components in musical sounds”, AES 9th Regional Convention, Tokyo, Japan, Preprint, pp. 22-25 (2001).
[5] S. Kiryu, K. Ashihara, “Problems in High-sampling Audio”, Technical Report of IEICE, EA99-10, pp. 47-53 (1999).
[6] K. Ashihara, S. Kiryu, “Detection threshold for tones above 22 kHz”, AES 110th Convention, Amsterdam, The Netherlands, Convention Paper 5401 (2001).
[7] D. Griesinger, “Perception of mid frequency and high frequency intermodulation distortion in loudspeakers, and its relationship to high-definition audio”, AES 24th International Conference, Banff, Alberta, Canada, Presentation Slides, http://world.std.com/~griesngr/intermod.ppt (2003).


Mr. Toshiyuki Nishiguchi Mr. Toshiyuki Nishiguchi
He received the B. Eng. and M. Eng. degrees from the University of Electro-Communications, Tokyo, Japan, in 1994 and 1996, respectively. He joined NHK in 1996. Since 1998, he has been with NHK Science and Technical Research Laboratories. He has been engaged in the researching on microphones and high-resolution audio. He is a member of the Acoustical Society of Japan, the Institute of Image Information and Television Engineers of Japan.
Mr. Kimio Hamasaki Mr. Kimio Hamasaki
He received the M.S. degrees in audio & visual communication design from Kyushu Institute of Design in 1982. And same year he joined NHK, Japan Broadcasting Corporation. He had been engaged in sound production, especially as a balance engineer of classical music, and also engaged in development of sound production for HDTV and R&D of digital sound facilities. He received several awards such as the Prixitalia "Perugia" Award, Finalist for International EMMY Awards and the CATs “Audio Award”, by his sound recording works.
Since 2000, he has been engaged in research on Audio at NHK Science & Technical Research Laboratories and he is currently a senior research engineer of three dimensional audio & visual systems division. He is a member of the Audio Engineering Society (AES), the Acoustical Society of Japan (ASJ), and the Institute of Image Information and Television Engineers of Japan (ITE), and the Japan Audio Society (JAS).
Mr. Masakazu Iwaki Mr. Masakazu Iwaki
He received the B. Eng. and M. Eng. degrees from the TUKUBA University, Ibaraki, Japan, in 1988 and 1990, respectively. He joined NHK in 1990. Since 1994, he has been with NHK Science and Technical Research Laboratories. He has been engaged in the researching into microphones and loudspeakers. He is a member of the Acoustical Society of Japan, the Institute of Electronics, Information and Communication Engineers (IEICE), and AES.
Dr. Akio Ando Dr. Akio Ando
He received the B.S. and M.S. degrees from Institute of Design in 1978 and 1980, respectively. He also received the Dr. Eng. degree from Toyohashi University of Technology in 2001. In 1980, he joined Japan Broadcasting Corporation (NHK). He has been with the Science and Technical Research Laboratories of Japan Broadcasting Corporation since August 1983. He was in charge of developing simultaneous subtitling systems for live broadcast TV programs using speech recognition, with which NHK started simultaneous subtitled broadcasting for daily news programs on March 2000, and sports and variety programs on December 2001 including the Winter Olympic Games from Salt Lake City 2002 and the 2002 FIFA World Cup Games. He is currently a senior research engineer of the Three Dimensional Audio-visual Systems Division at the Laboratories. His research interests include pattern recognition, signal processing and acoustics. He is a member of the Institute of the Electrical and Electronics Engineers (IEEE), the Acoustical Society of Japan (ASJ), the Information Processing Society of Japan, the Association of Natural Language Processing of Japan and the Institute of Image Information and Television Engineers of Japan (ITE).


Copyright 2004 NHK (Japan Broadcasting Corporation) All rights reserved. Unauthorized copy of the pages is prohibited.

BackHome